SiftLog by M Media Software Lab
SiftLog ingests log streams from every source simultaneously, merges them into a single time-ordered stream, and tells you which service failed first - before any engineer on the bridge call finishes their first log query. Signals stream live to the free Android app over your LAN or VPN.
The Problem
When a production incident fires at 3am, you have engineers on a bridge call and log streams from a dozen services scrolling in separate windows. The dashboard says latency is up and error rate is spiking. It does not tell you which service failed first. It does not tell you whether this is a cascade from an upstream dependency.
Every engineer on that call is manually reading logs, comparing timestamps across systems with different clock configurations, trying to reconstruct a timeline inside their head. This takes 20 to 40 minutes in a well-run organization.
SiftLog eliminates those 20 to 40 minutes.
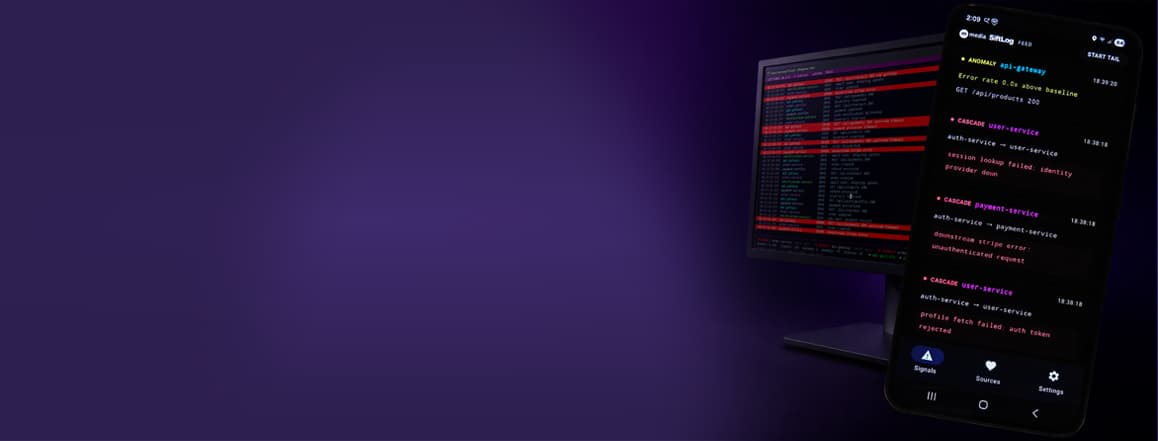
What the Output Looks Like
SiftLog processes all 20 sources simultaneously. The 61,204 log events from 16 healthy services are suppressed. The 9 events that explain the failure are surfaced in order, with the origin service identified, in 0.8 seconds.
The cascade origin is auth-service. The propagation chain is named. The silence flag on inventory-service - a separate unrelated issue - is surfaced automatically. Without SiftLog, it would have been invisible until someone noticed the service was gone.
Two Editions
The production-grade distribution. An always-on daemon that runs continuously against all your log sources, stores signal history, and surfaces failures the moment they propagate - on your terminal and on your phone.
The full correlation engine as a Go library and CLI. Review the source, evaluate the detectors against your own logs, or embed the library in your own tooling - no account required.
Why It Exists
3am calls are the worst. Not because of the hour -- because everyone's looking at their own service and nobody knows where to start. My first thought was: what if you just tail everything at once and merge it by timestamp? If you can see all your services in a single time-ordered stream, the origin of a failure should be obvious.
"So I built that. Then I kept building. The Android app was the moment it clicked -- I saw a cascade signal on my phone before I had my laptop open. That felt like the whole point."
- Jeff Mutschler, M Media Software Lab