SiftLog Platform – Enterprise is an always-on daemon that reads from your existing log
infrastructure, merges every source into a single time-ordered stream, and tells you which
service failed first. No agents. No instrumentation changes. No schema requirements. When
something breaks at 3am, you read 9
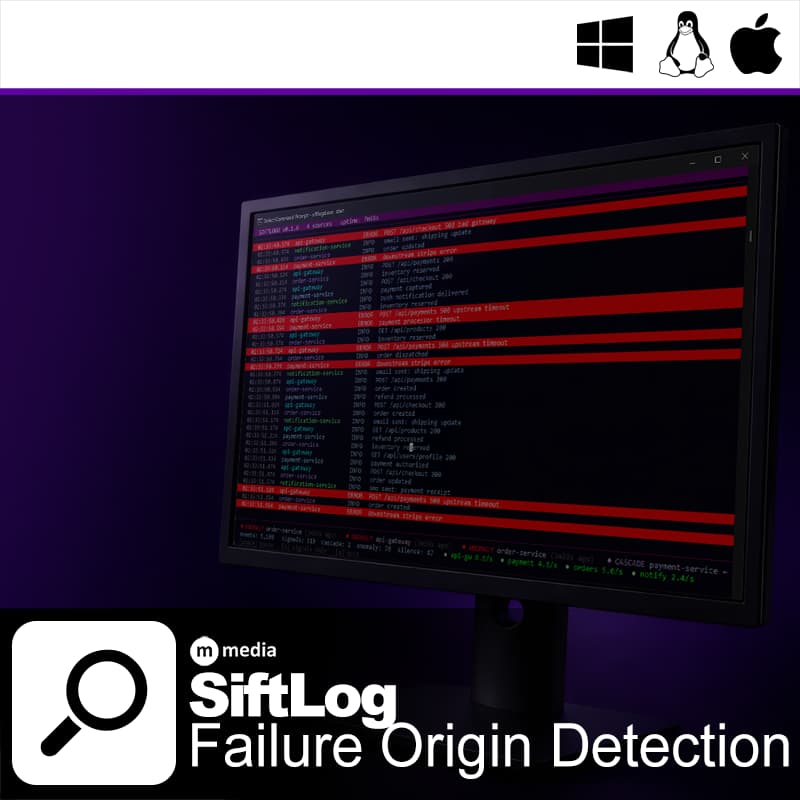
SiftLog Platform is an always-on daemon that reads from your existing log infrastructure, merges every source into a single time-ordered stream, and tells you which service failed first. No agents. No instrumentation changes. No schema requirements. When something breaks at 3am, you read 9 lines instead of 61,000.
It connects to Loki, CloudWatch, Elasticsearch, Datadog, Google Cloud Logging, and local log files simultaneously. The correlation engine runs three detectors continuously against the merged stream. When a failure originates in one service and propagates downstream, SiftLog identifies the origin and names the propagation chain — before any engineer has finished their first log query.
SiftLog suppresses noise and surfaces signals. The output is a short list of events worth reading, not a dashboard with more numbers to interpret.
SiftLog Platform is a single self-contained binary. Write a YAML config file pointing at your log sources. Run siftlogd start. The terminal UI launches automatically and begins processing immediately.
The correlator maintains a per-service sliding window of recent error events across all sources, merged into a single time-ordered stream. Clock skew between sources is detected and flagged inline. When signal conditions are met, the relevant events are extracted, the noise is suppressed, and the signal is written to the terminal and to persistent local storage.
Signal history is written to a SQLite database at ~/.siftlogd/signals.db. Post-incident review does not require log re-ingestion – the signal record is already there, timestamped and queryable.
This matters for financial services, healthcare, defense contractors, and any organization with strict data residency requirements.
$4,999/year – up to 10 servers. One Team license covers up to 10 concurrent running instances across your infrastructure. The license is validated at startup and re-verified every 24 hours. A 7-day grace period applies if the license server is temporarily unreachable.
Enterprise agreements with unlimited deployments, air-gapped activation, SLA, and purchase order / net-terms procurement are available – contact us. M Media Software Lab is a registered US vendor with DUNS and EIN on file.
After purchase, your license key and binaries for all five supported platforms are delivered by email within one business day. SHA-256 checksums are included with every release.
SiftLog Platform |
Open Source Library on GitHub |
license@mmediasoftwarelab.com
lines instead of 61,000.
It connects to Loki, CloudWatch, Elasticsearch, Datadog, Google Cloud Logging, and local
log files simultaneously. The correlation engine runs three detectors continuously against
the merged stream. When a failure originates in one service and propagates downstream,
SiftLog identifies the origin and names the propagation chain — before any engineer has
finished their first log query.
SiftLog suppresses noise and surfaces signals. The output is a short list of events worth
reading, not a dashboard with more numbers to interpret.
SiftLog Platform is a single self-contained binary. Write a YAML config file pointing at
your log sources. Run siftlogd start. The terminal UI launches automatically
and begins processing immediately.
The correlator maintains a per-service sliding window of recent error events across all
sources, merged into a single time-ordered stream. Clock skew between sources is detected
and flagged inline. When signal conditions are met, the relevant events are extracted, the
noise is suppressed, and the signal is written to the terminal and to persistent local
storage.
Signal history is written to a SQLite database at ~/.siftlogd/signals.db.
Post-incident review does not require log re-ingestion — the signal record is already
there, timestamped and queryable.
This matters for financial services, healthcare, defense contractors, and any organization
with strict data residency requirements.
$990 — annual license, per server. One license covers one running instance
on one server. The license is validated at startup and re-verified every 24 hours. A 7-day
grace period applies if the license server is temporarily unreachable.
Volume pricing is available for multi-server deployments. Enterprise agreements with
air-gapped activation, SLA, and purchase order / net-terms procurement are available.
M Media Software Lab is a registered US vendor with DUNS and EIN on file.
After purchase, your license key and binaries for all five supported platforms are delivered
by email within one business day. SHA-256 checksums are included with every release.
SiftLog Platform |
Open Source Library on GitHub |
license@mmediasoftwarelab.com
SiftLog Platform reads from your existing log infrastructure - Loki, CloudWatch, Elasticsearch, Datadog, Google Cloud Logging, and local files -…
SiftLog Platform reads from your existing log infrastructure - Loki, CloudWatch, Elasticsearch, Datadog, Google Cloud Logging, and local files -…
Modern software has become surveillance dressed as convenience. Every click tracked, every behavior analyzed, every action monetized. M Media software doesn't play that game.
Our apps don't phone home, don't collect telemetry, and don't require accounts for features that should work offline. No analytics dashboards measuring your "engagement." No A/B tests optimizing how long you stay trapped in the interface.
We build tools, not attention traps.
The code does what it says on the tin — nothing more, nothing less. No hidden services running in the background. No dependencies on third-party APIs that might disappear tomorrow. No frameworks that require 500MB of node_modules to display a button.
M Media software isn't venture-funded, trend-chasing, or built to look good in pitch decks. It's built by developers who run their own servers, ship their own products, and rely on these tools every day.
That means fewer abstractions, fewer dependencies, and fewer "coming soon" promises. Our software exists because we needed it to exist — to automate real work, solve real problems, and keep systems running without babysitting.
We build software the way it used to be built: practical, durable, and accountable. If a feature doesn't save time, reduce friction, or make something more reliable, it doesn't ship.
This is software designed to stay installed — not be replaced next quarter.