It’s 2am. Your infrastructure. In Your Pocket.
SiftLog Platform ingests log streams from every source in your infrastructure, merges them in real time, and surfaces the origin of failures automatically. Cascade, anomaly, silence – detected and named, in under a second. Signals stream live to the free Android app over your LAN or VPN. This is usually the story of a problem that costs teams hours every time it happens, a gap that every monitoring vendor has quietly decided to live with, and the tool built to close it.
The Call Nobody Wants
It starts the same way every time. A PagerDuty alert. A Slack message from someone who was already awake. Your phone screen lighting up the ceiling at 2am. You are now the engineer on the bridge call, and the bridge call already has four people on it, and none of them know what is broken yet.
The dashboard says something is wrong. Latency is up. Error rate is spiking. The dashboard is doing exactly what it was designed to do: tell you that something is wrong. What it cannot do – what it was never designed to do – is tell you which service failed first, whether this is a cascade from an upstream dependency, or how long the affected services have actually been degraded before the alerting thresholds caught it.
So you open logs. Multiple browser tabs. Kibana in one, CloudWatch in another, maybe a Loki query in a third. You start reading. You are looking for the first ERROR message in a sea of INFO messages, trying to reconstruct a timeline in your head from three separate timestamp formats across services that may or may not have synchronized clocks.
This is the gap. Between “the dashboard says something is wrong” and “I know what is wrong,” there is a gulf that every monitoring vendor has quietly accepted as the cost of doing business. That gap costs teams twenty to forty minutes on a well-run incident. It costs significantly more on a complex one. It costs reputations and sleep and SLA credits and, sometimes, customers.
SiftLog was built to close it.
What Actually Happens During a Cascade
To understand why SiftLog matters, you have to understand the shape of the problem it solves. Most production incidents are not a single service failing cleanly. They are cascades: one service fails, the services that depend on it start failing, the services that depend on those start degrading, and within sixty seconds you have four services generating thousands of error events while sixteen other services continue to run fine and generate their normal INFO-level noise.
The signal – the actual root cause – is buried in that noise. Not metaphorically buried. Literally buried. A well-running microservices architecture at any meaningful scale might generate fifty thousand log events every five minutes during normal operation. During an incident, when four services are in varying states of failure and retry loops are firing, that number does not go down. It goes up. The signal-to-noise ratio inverts exactly when you most need it to go the other direction.
The senior engineer who joins a bridge call at 2am and instantly knows what is wrong is not smarter than everyone else on the call. They have just done this enough times, with this specific architecture, that they have internalized the pattern. They know which services are upstream dependencies of which other services. They know that when the auth service goes quiet, the API gateway starts throwing 503s within about two seconds. They know what a connection pool exhaustion looks like versus a downstream timeout.
That knowledge is not in your dashboards. It is not in your alerting rules. It lives in one person’s head, and when that person is on vacation, your mean time to resolution doubles.
The Signal
SiftLog does not replace your log aggregation layer. It does not ask you to change how your services log, or install agents, or restructure your infrastructure. It connects to whatever aggregation layer you already have – Grafana Loki, AWS CloudWatch, Elasticsearch, Datadog, Google Cloud Logging, or local files – and it runs three detectors continuously against the merged event stream.
The first is cascade detection. When service A begins generating errors and service B starts degrading within a configurable time window – particularly when events share a trace ID – SiftLog identifies the origin service and names the propagation chain in order. Not “here are four services with elevated error rates.” The origin service is named first. The downstream chain follows. The signal reads like a sentence:
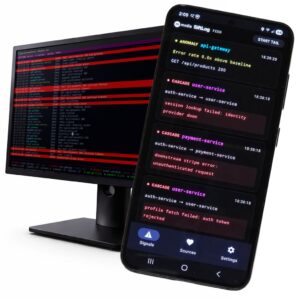
[signal:cascade] auth-service → api-gateway → user-service → session-manager
The second detector is anomaly rate detection. Per-service error rates are tracked against a rolling baseline. When a service exceeds a configurable multiple of its recent error rate, it is flagged before your alerting thresholds fire. The baseline is per-service and rolling, which means a service that normally generates ten errors per five minutes and suddenly generates three hundred is flagged immediately, while a noisy service that always generates high error volume is not falsely flagged just because it remains at its normal elevated rate.
The third detector is the one that catches the failure mode that manual log review most consistently misses: silence. A service that stops logging is often the most critical signal of all. When a service that normally generates eight hundred events every five minutes suddenly goes quiet, that silence is data. SiftLog tracks per-service event volume and flags services that fall below a configurable threshold of their baseline output. The service that stops talking is often the service that has completely stopped working.
Twenty Microservices. One Broken. Found in 0.8 Seconds.
Here is the scenario that motivated the build. Twenty microservices running in a production environment. A database connection pool in the auth service exhausts – a configuration error, a slow query, it does not matter what caused it. Within seconds, four services are generating thousands of error events. The other sixteen are running fine.
A senior engineer joins the bridge call fifteen minutes in. Four engineers are already on it. Nobody has the full picture yet, because reading twenty log streams across three different aggregation tools while trying to reconstruct a timeline from timestamps that are not quite synchronized is genuinely hard work, even for experienced people.
SiftLog, running continuously against all twenty sources, has already done the following: identified auth-service as the cascade origin, named the propagation chain through api-gateway, user-service, and session-manager in order, separately flagged inventory-service for a silence event (a completely unrelated issue – inventory-service has been intermittently quiet for four minutes, which nobody has noticed because everyone is focused on the error spike), and suppressed 61,204 events as noise, surfacing the nine events that actually matter.
The total time from incident start to named cascade origin: 0.8 seconds.
The senior engineer who joins the bridge call fifteen minutes late opens the SiftLog terminal UI and immediately has a complete picture. Not a slightly better picture. A complete one.
The Tool That Was Missing
The observability market is enormous. There are tools for every layer of the stack: metrics, traces, logs, profiling, synthetic monitoring, real user monitoring. The investment in this space over the last decade has been extraordinary, and the tools are genuinely good. Grafana, Datadog, New Relic, Honeycomb — these are not bad tools. They are excellent tools.
They are tools that tell you something is wrong. They do not tell you what is wrong first.
That distinction sounds minor until it is 2am and you are the person on the bridge call. Then it is everything. The dashboard tells you latency is up. The dashboard tells you error rate is spiking. The dashboard does not tell you which of your twenty services caused the latency spike, or whether the error rate spike is a root cause or a consequence, or why that one service went quiet twenty minutes ago and nobody noticed.
SiftLog is the layer that sits between your log aggregation and your human brain, and does the one thing that layer has never done before: reads across all your sources simultaneously, correlates events by time and by dependency pattern, and tells you the story of what happened in plain language before the first engineer on the bridge call finishes their first log query.
Private by Design
Your log data is the most sensitive operational data your organization produces. It contains stack traces, user IDs, internal API endpoints, authentication token fragments, database query patterns, and the internal architecture of your systems in more detail than any architecture diagram your team has ever drawn.
SiftLog does not touch that data. The daemon reads from your existing aggregation layer – it does not receive your logs, it queries them. No log content is transmitted to any SiftLog server. No signal results are transmitted. No operational telemetry is collected. The daemon processes your logs locally, generates signals locally, and stores signal history locally in a SQLite database on the host where it runs.
The only outbound connection SiftLog makes is license verification: your license key and a machine ID, sent once at startup and then once every twenty-four hours. That is it. If the license server is unreachable – network blip, maintenance, whatever – SiftLog runs for seven days on a grace period before requiring re-verification. The daemon does not stop mid-incident because of a license server timeout.
For organizations with strict data residency requirements – financial services, healthcare, defense contractors, government – enterprise agreements with fully air-gapped activation are available. The license key can be activated once, and the daemon can run indefinitely without any outbound connection.
In Your Pocket
The name is not metaphorical. The free SiftLog Android app connects directly to your running daemon over your LAN or VPN and streams signals in real time. Not summaries. Not delayed notifications. Live signals, the moment they are detected, streamed directly to the device in your pocket.
When a cascade fires at 2am, your phone knows. When a service goes quiet, your phone knows. When the anomaly detector flags a service that has just exceeded three times its baseline error rate, your phone knows – before your alerting thresholds have had time to fire, before your monitoring dashboard has refreshed, before the first PagerDuty notification has been dispatched.
The connection is direct. The app connects to your daemon over your corporate LAN, your corporate VPN, or a Tailscale mesh. There is no cloud relay. There is no third-party server in the middle. Your signal data – which describes the failure patterns of your production infrastructure in real time – never passes through any server you do not control.
Setting up the Android connection takes about forty seconds. You add four lines to your siftlog.yaml – enable the API, set a port, set a bind address, set an API key of your choosing – and then you enter your server’s IP address and API key in the Android app. That is the entire setup. The app has been available on Google Play since the Platform launched.
The Open Source Foundation
SiftLog did not start as a commercial product. It started as an open source Go library, MIT licensed, built as a correlation engine that any application could embed. The library implements all three signal detectors – cascade, anomaly, silence – along with the adapters for every supported log source. The full source is on GitHub.
The open source CLI wraps the library and exposes it as a command-line tool. You can run it against your logs right now, without an account, without a license key, without providing any information to anyone. Point it at a log file, or a Loki instance, or a CloudWatch log group, and it will start detecting signals immediately.
The CLI is genuinely useful for one-time investigations – running it against a historical log archive to understand an incident you are post-morteming, or pointing it at a staging environment to validate your dependency assumptions before a deployment. Many teams use it for months before licensing the Platform.
The Platform is what runs continuously. The always-on daemon, the persistent signal history, the terminal UI, the REST API, the Android app integration – that is the Platform, and that is what requires a license. But the engine that powers it, the correlation logic that does the actual work, is open source and always will be. You can read every line of code that makes the decisions before you decide whether to trust it with your production infrastructure.
One Tuesday at 2am
The story of how SiftLog was built is not a story about a well-funded startup with a product roadmap and a go-to-market strategy. It is a story about a problem that was interesting enough to still be interesting at 2am on a Tuesday when the person who built it could not sleep.
“I spent three years complaining about the gap between ‘the dashboard says something is wrong’ and ‘I know what is wrong.’ I built SiftLog at 2am on a Tuesday when I couldn’t sleep and the problem was still interesting. If it helps you, it was worth the Tuesday.”
– Jeff Mutschler, M Media
M Media Software Lab is a small software company based in Austin, Texas. It builds focused, lightweight tools designed to do one thing very well. SiftLog is the most technically ambitious thing the lab has shipped, and it exists entirely because the problem it solves is genuinely unsolved by every other tool in the space.
The lab is a registered US vendor with DUNS and EIN on file, eligible for purchase order and net-terms procurement. Enterprise agreements with multi-site deployment, air-gapped activation, SLA commitments, and vendor onboarding support are available. The business is set up to work the way enterprise procurement departments expect it to work.
What This Changes
The 2am bridge call does not go away. Production incidents do not go away. The gap between “something is wrong” and “I know what is wrong” has always been a human problem – the engineers on the call are not less capable because they are reading logs at 2am, they are working with a tool set that was never designed to answer the question they are actually asking.
SiftLog answers it. Not better than before. Not faster than before. It answers a question that was not answerable before without a senior engineer who had memorized your dependency graph and had enough incident experience to pattern-match their way to a root cause in real time.
That knowledge is no longer locked in one person’s head. It is not lost when that person is on vacation, or has moved to another team, or has left the company. The cascade detector knows your service dependency patterns from the event correlations it observes. The silence detector tracks every service you have, not just the ones that are currently making noise. The anomaly detector builds a baseline for every service independently, so it knows what normal looks like for each one.
The engineer who joins the bridge call at 2am opens the SiftLog terminal UI or pulls up the Android app and reads a sentence. The sentence names the origin service. The sentence names the propagation chain. The sentence tells them what went quiet and when.
Then the call ends faster. The incident is resolved faster. The post-mortem is richer because the timeline is not reconstructed from memory and log timestamps but read directly from the signal history. The on-call engineer gets back to sleep faster.
That is not a small thing at 2am.
Getting Started
The open source CLI is available now via go install github.com/mmediasoftwarelab/siftlog@latest. No account required. Point it at your logs and it starts working immediately.
The Platform – the always-on daemon with the terminal UI, persistent history, REST API, and Android app integration – is licensed at $999 per server per year. One license covers one running instance on one server. After purchase, your license key and binaries for all supported platforms (Linux amd64 and arm64, macOS Intel and Apple Silicon, Windows 64-bit) are delivered by email within one business day. SHA-256 checksums are included with every release.
Volume pricing is available. Enterprise agreements with air-gapped activation and SLA commitments are available. Questions go to license@mmediasoftwarelab.com.
The Android app is free on Google Play. A valid Platform license running on the server is required to connect.
The next time it is 2am and something is broken, the question “what failed first” should have an answer in under a second. SiftLog is that answer.